Triglyceride Glucose-Waist Circumference Is Superior to Other Biochemical Indicators for Diagnosing Prehypertension and Hypertension
| dc.contributor.author | Vera-Ponce, V.J. | |
| dc.contributor.author | Garcia-Lara, R.A. | |
| dc.contributor.author | Torres-Malca, J.R. | |
| dc.contributor.author | Loayza-Castro, J.A. | |
| dc.contributor.author | Ramirez-Ortega, A.P. | |
| dc.contributor.author | Zuzunaga-Montoya, F.E. | |
| dc.contributor.author | Paucar, C.R.I. | |
| dc.contributor.author | De La Cruz-Vargas, J.A. | |
| dc.date.accessioned | 2025-10-31T18:42:49Z | |
| dc.date.available | 2025-10-31T18:42:49Z | |
| dc.date.issued | 2023 | |
| dc.identifier.uri | https://hdl.handle.net/20.500.12805/5999 | |
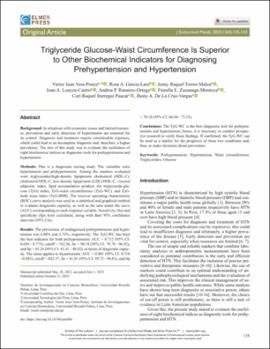
| dc.description.abstract | Background: In situations with economic issues and limited resources, prevention and early detection of hypertension are essential for its control. Diagnosis and treatment require considerable expenses, which could lead to an incomplete diagnosis and, therefore, a higher prevalence. The aim of this study was to evaluate the usefulness of eight biochemical indices as diagnostic tools for prehypertension and hypertension. Methods: This is a diagnostic testing study. The variables were hypertension and prehypertension. Among the markers evaluated were triglycerides/high-density lipoprotein cholesterol (HDL-C), cholesterol/HDL-C, low-density lipoprotein (LDL)/HDL-C, visceral adiposity index, lipid accumulation product, the triglyceride-glucose (TyG) index, TyG-waist circumference (TyG-WC), and TyG-body mass index (TyG-BMI). The receiver operating characteristic (ROC) curve analysis was used as a statistical and graphical method to evaluate diagnostic capacity, as well as the area under the curve (AUC) corresponding to each response variable. Sensitivity (Se) and specificity (Sp) were calculated, along with their 95% confidence intervals (95% CIs). Results: The prevalence of undiagnosed prehypertension and hypertension was 6.88% and 2.72%, respectively. The TyG-WC has been the best indicator for both prehypertension: AUC = 0.712 (95% CI: 0.650-0.775), cutoff = 762.56, Se = 90.74 (95% CI: 79.70-96.92), and Sp = 45.24 (95% CI: 41.61-48.92), in terms of diagnostic capacity. The same applies to hypertension: AUC = 0.801 (95% CI: 0.718-0.883), cutoff = 862.57, Se = 81.81 (95% CI: 59.72-94.81), and Sp = 70.18 (95% CI: 66.84-73.35). Conclusions: The TyG-WC is the best diagnostic tool for prehypertension and hypertension; hence, it is necessary to conduct prospective research to verify these findings. If confirmed, the TyG-WC can be used as a marker for the prognosis of these two conditions and, thus, to make decisions about prevention. | en_US |
| dc.description.sponsorship | The authors of this study wish to extend their gratitude to the Institute of Biomedical Science Research at Ricardo Palma University for the support provided in the development of this work. | |
| dc.format | application/pdf | |
| dc.language.iso | eng | |
| dc.publisher | Elmer Press | |
| dc.relation.ispartof | urn:issn:1923-2861 | |
| dc.rights | https://purl.org/coar/access_right/c_abf2 | |
| dc.rights.uri | https://creativecommons.org/licenses/by-nc-sa/4.0/ | |
| dc.subject | Innovative Approaches in Diabetes Management and Monitoring | en_US |
| dc.subject | Triglyceride-Glucose Index and Insulin Resistance | en_US |
| dc.title | Triglyceride Glucose-Waist Circumference Is Superior to Other Biochemical Indicators for Diagnosing Prehypertension and Hypertension | en_US |
| dc.type | https://purl.org/coar/resource_type/c_2df8fbb1 | |
| dc.identifier.doi | https://doi.org/10.14740/jem886 | |
| dc.subject.ocde | https://purl.org/pe-repo/ocde/ford#3.02.18 | |
| dc.type.other | Research article | |
| dc.identifier.journal | Journal of Endocrinology and Metabolism | |
| dc.type.version | https://purl.org/coar/version/c_970fb48d4fbd8a85 |
Files in this item
This item appears in the following Collection(s)
-
Artículos de Investigación [1294]

Except where otherwise noted, this item's license is described as https://purl.org/coar/access_right/c_abf2